With a large amount of data being generated in the world every second, it becomes necessary to track data as much as possible so that current situations can be thoroughly analyzed and important conclusions can be drawn from the same.
Taarifa is one such online platform for crowd sourced reporting and triaging of infrastructure related issues. It is a platform which allows citizens to engage with the government and register their issues with the local infrastructure of their area. This project aims to analyze the data collected by Taarifa and the Tanzanian Ministry of Water.
Problem Description
You can read about the problem description here.
https://www.drivendata.org/competitions/7/pump-it-up-data-mining-the-water-table/page/25/
I took part in this competition along with my two colleagues and our goal was to predict the operating condition of a water-point for each entry in the test dataset. To be able to predict, we had to train a classifier such as a Random Forest or an Adaboost on the training data provided. Both the training data and the test data comprised of 39 attributes which were used to build the model and make the predictions respectively.
Dataset Description
Total number of attributes: 39
Number of training instances: 59400
Number of testing instances: 14850
Class labels: Functional, Functional but needs repair and Non-functional.
The following are the 39 attributes used to build a model:
1. amount_tsh: Amount of water available to the waterpoint.
2. date_recorded: Date of entry.
3. funder: Person who funded the well.
4. gps_height: Altitude of the well.
5. installer: Organization that installed the well.
6. longitude: GPS Longitudinal coordinate.
7. latitude: GPS Latitudinal coordinate.
8. wpt_name: Name of the waterpoint.
9. num_private: Private number.
10. basin: Geographic water basin.
11. subvillage: Geographic location.
12. region: Geographic location.
13. region_code: Geographic location code.
14. district_code: Geographic location code.
15. lga: Geographic location.
16. ward: Geographic location.
17. population: Population around the well.
18. public_meeting: True/False.
19. recorded_by: Person entering the data.
20. scheme_management: One who operates the waterpoint.
21. scheme_name: Who operates the waterpoint.
22. permit: If a permit exists for the waterpoint or not.
23. construction_year: Year of construction of the waterpoint.
24. extraction_type: Kind of extraction that the waterpoint uses.
25. extraction_type_group: Kind of extraction that the waterpoint uses.
26. extraction_type_class: Kind of extraction that the waterpoint uses.
27. management: How the waterpoint is managed.
28. management_group: How the waterpoint is managed.
29. payment: What the water costs.
30. payment_type: What the water costs.
31. water_quality: Quality of the water.
32. quality_group: The quality of the water.
33. quantity: The quantity of water.
34. quantity_group: The quantity of water.
35. source: Source of water.
36. source_type: The source of water.
37. source_class: The source of water.
38. waterpoint_type: The kind of waterpoint.
39. waterpoint_type_group: The kind of waterpoint.
Pre-Processing Techniques
Step 1: Remove redundant attributes
At the outset, we decided to take a close look at the 39 attributes provided. Our first impression upon taking a closer look was that a few attributes seemed redundant. That is, it seemed repetitive to have an Attribute B as part of the model when another Attribute A was already a part of it. For example, waterpoint_type and waterpoint_type_group. Another such example is quantity and quantity group.
Step 2: Remove attributes that have just one category
We found attributes that just had one category in all. Since such an attribute would be in no way useful for predicting the final class label, we decided to remove this attribute from our model. Example: recorded_by had just one category – GeoData Consultants Ltd.
Step 3: Combining attributes to achieve a more meaningful attribute
We figured that the age of a well would strongly have to do with whether it is functional or not. So, we decided to track that in our model. To achieve this, we took attributes date_recorded and construction_year. We took the difference in values of these two attributes as the age of the well, as of the time of recording.
Step 4: Remove rows containing missing or 0 data as required
There were quite a few rows that had missing data (0 or blank) for some of the attributes that we were considering in the model. We decided to not consider the partial data available in these rows and hence, these rows were not fed to the classifier during model building.
Step 5: Analyze the class labels of the training data
To check if the training data is skewed in favour of any one class label, we decided to check the proportion of each class label.
Instances with class label Functional: 32259
Instances with class label Non-functional: 22824
Instances with class label Functional but needs repair: 4317
Total number of instances: 59400
Percentage Functional: 54.3%
Percentage Non-functional: 38.42%
Percentage Functional but needs repair: 7.26%
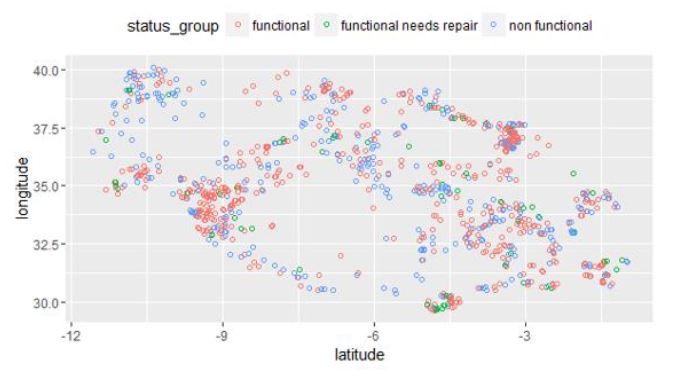
Step 6: Since the latitudes and longitudes are given, we can draw a spatial plot of wells per their class labels.
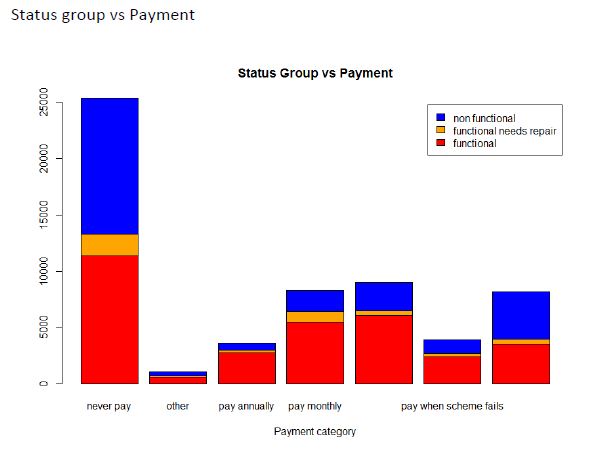
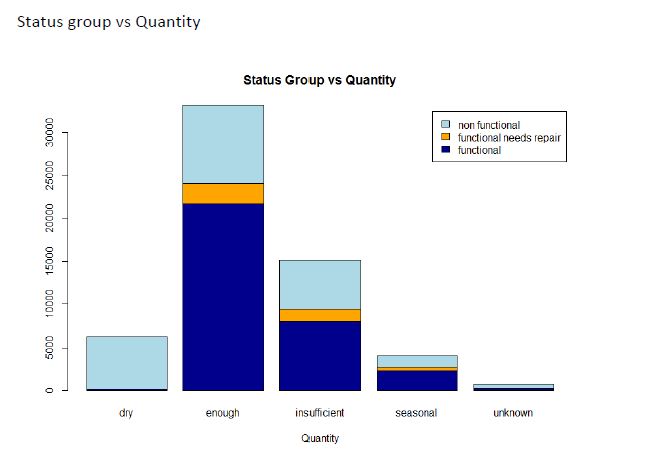
Step 7: Analyze a few other attributes with respect to the class labels.
Plotting the following helps us understand how the class labels are distributed among the categories of the corresponding attributes.


Proposed Solution and Methods
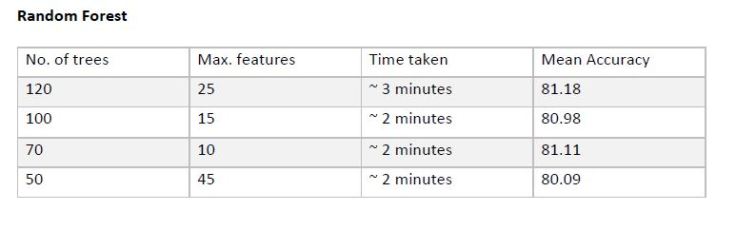
Approach 1: Random Forest
Random Forests is an ensemble learning method which is achieved by constructing many decision trees and choosing the final class label as the mode of the class labels.
Library used:
http://scikit-learn.org/stable/modules/generated/sklearn.ensemble.RandomForestClassifier.html
https://pypi.python.org/pypi/category_encoders
The big motivation behind wanting to use Random Forest is the fact that it is one of the most accurate classifiers available for many datasets.
Approach 2: Deep Learning
Deep Learning is a branch of Machine Learning that models data abstraction by employing a deep graph with usually many layers of linear and non-linear transformations.
Library used:
http://scikit-learn.org/stable/modules/neural_networks_supervised.html
https://pypi.python.org/pypi/category_encoders
One big advantage of deep Learning is that we can help build a complex classifier without using or needing too many features.
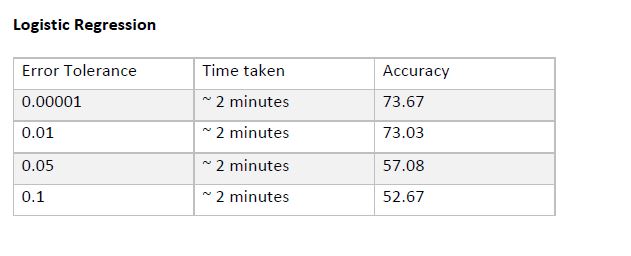
Approach 3: Logistic Regression
Logistic Regression is a type of classifier that predicts the probabilities of different possible outcomes of the categorical Response variable.
Library used:
http://scikit-learn.org/stable/modules/generated/sklearn.linear_model.LogisticRegression.html
https://pypi.python.org/pypi/category_encoders
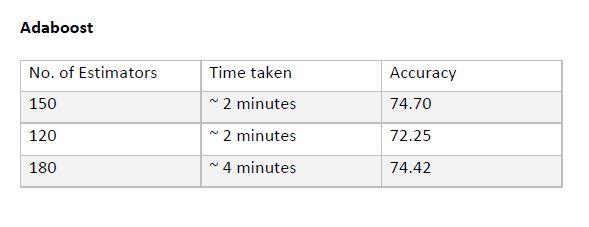
Approach 4: Adaboost
Adaboost or Adaptive boosting is a very effective technique of combining several weak classifiers to produce an overall strong classifier.
Library used: http://scikit-learn.org/stable/modules/generated/sklearn.ensemble.AdaBoostClassifier.html
https://pypi.python.org/pypi/category_encoders
The advantage with Adaboost is that it works well with both basic and complex problems. It produces a highly accurate classifier using a series of weak classifiers (the result of the first weak classifier is fed to the second weak classifier and so on.)
Experimental Results and Analysis

Conclusion
Below is the graph of Accuracy (vs) classifier. The accuracy seen below is the best accuracy that was achieved by the corresponding classifier.
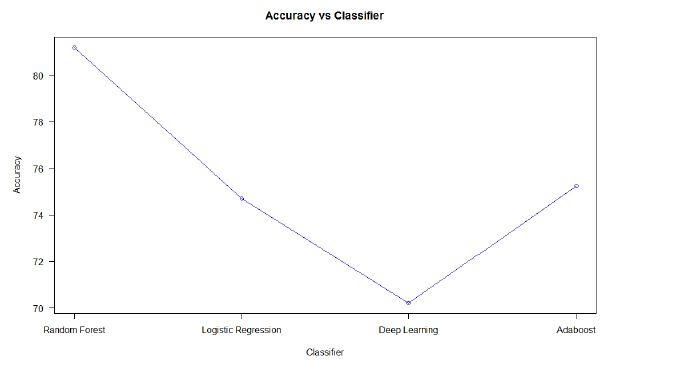
After running the four classifiers over the training dataset for many iterations and with different parameters, we found that the Random Forest classifier with number of trees = 120, number of features = 25 turned out to be the strongest classifier with an accuracy of 81.18%.
When we tested our classifier against the test data we got an accuracy of 80.59%.
References
http://www.scikit-learn.org
https://community.drivendata.org/c/pump-it-up-data-mining-the-water-table
https://www.kaggle.com
https://pypi.python.org/pypi/category_encoders

Leave a comment